
JMP Tutorial:
Getting JMP Graphics Into Word
Click the link below and save the following JMP file to your Desktop:
Now go to your Desktop and double click on the JMP file you just downloaded.
This action will start JMP and display the content of this file:

Click the Analyze menu, then select Distribution.
Click the column Percent, then click Y, Columns.
Click OK.
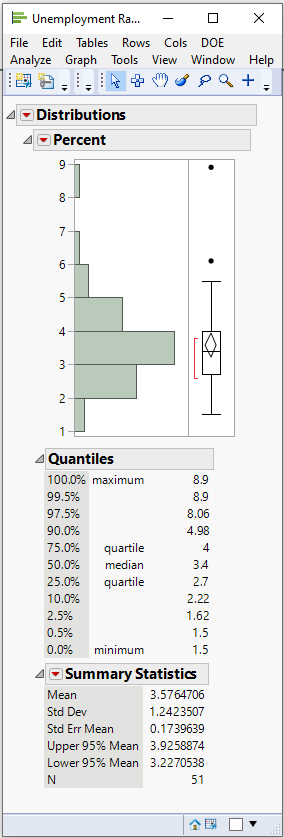
You should now see:
Click the Tools menu and pull to the Selection tool.

Suppose you want to place all of this output in your report.
Place the selection cursor on the word Percent and click.
All of the output should now be highlighted.

Go to the Edit menu and select Copy.
Now go to Word and position your cursor where you want your image.
At the Home tab, click the drop down
arrow below Paste, then select Past Special...)
Select Bitmap (on a MAC select PDF or Picture) then click OK.
MAC USERS: These images may paste into Word larger on a MAC computer than on a PC.
You can resize the resulting image by clicking on
it, and clicking and dragging the box in the lower right corner. The image
can also be moved left, right, up or down by clicking and dragging.
Suppose you only want the histogram in your report. In JMP, click anywhere on the highlighted output to de-highlight your previous selection. Position your selection cursor on the far left edge of the histogram and click. If you click too close to the numbers of the x-axis, only the x-axis will be highlighted, like this:

If you are not happy with what you have highlighted, keep moving the selection cursor around and click until you have what you want highlighted:

Follow the instructions above to copy and paste your image into Word.
(Based on JMP Pro 16.0.0 Revised 06/24/2021)