
Click the link below and save the following JMP file to your Desktop:
Now go to your Desktop and double click on the JMP file you just downloaded.
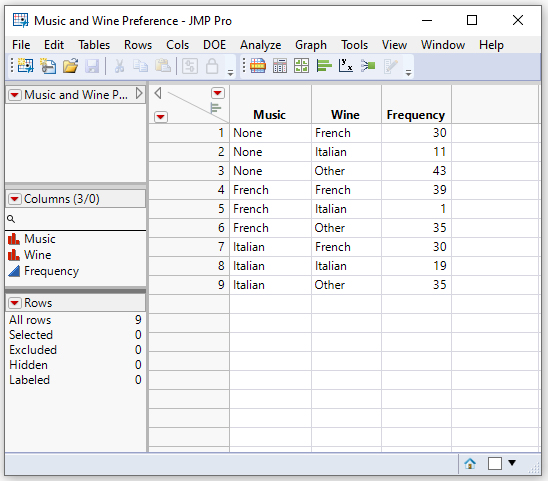
This action will start JMP and display the content of this file:
Click on the Analyze menu, select Fit Y by X.
Click the Wine column, then click Y, Response.
Click the Music column, then click X, Factor.
Click the Frequency column, then click Freq.
You should now see:

Click OK.
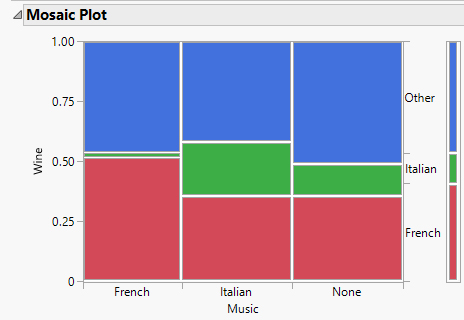
The following output results.
Note: If your data are not "aggregated", and there is no "Frequency" column, simply place nothing in the Freq box.
(Based on JMP Pro 16.0.0 Revised 7/6/2021)