
Click the link below and save the following JMP file to your Desktop:
Now go to your Desktop and double click on the JMP file you just downloaded.
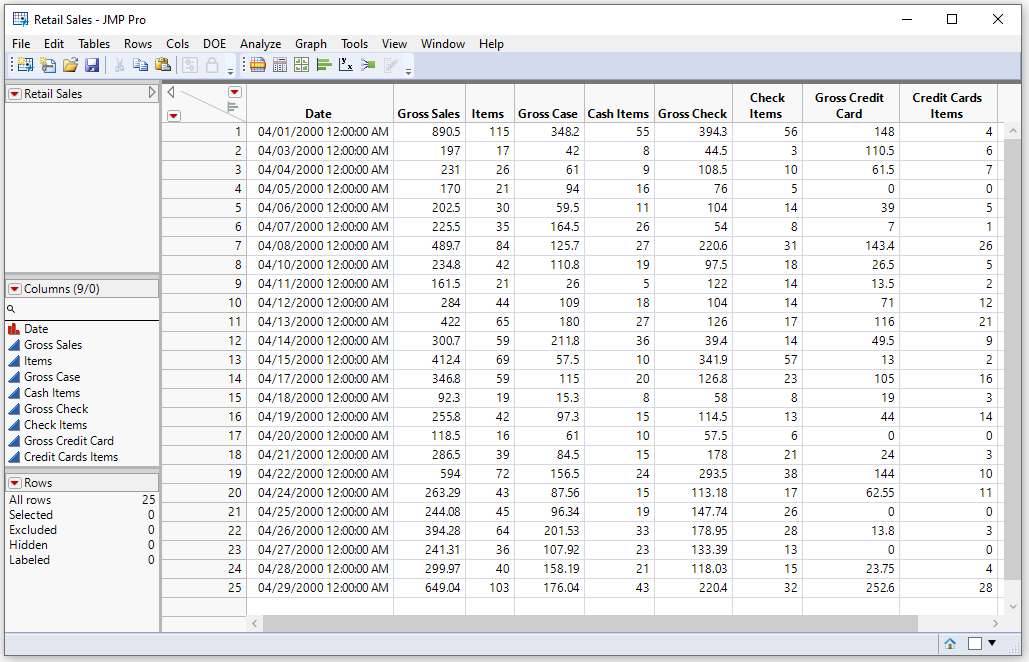
This action will start JMP and display the content of this file:
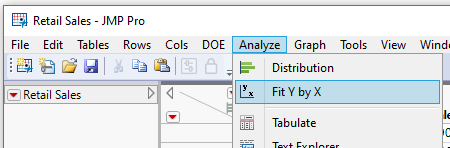
Go to the Analyze menu and select Fit Y by X:
Click the column Gross Sales, then click Y, Response.
Click the column Items, then click X, Factor.
Your screen should now look similar to the following:
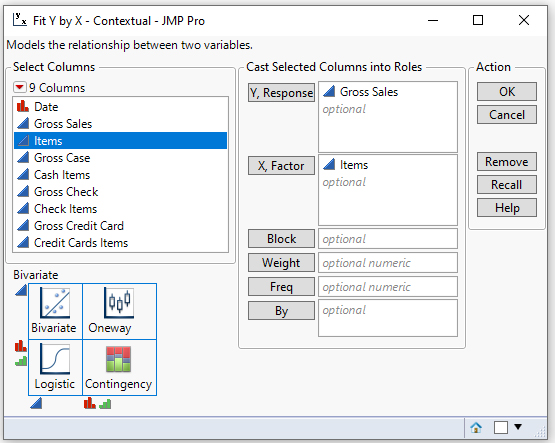
Click OK.
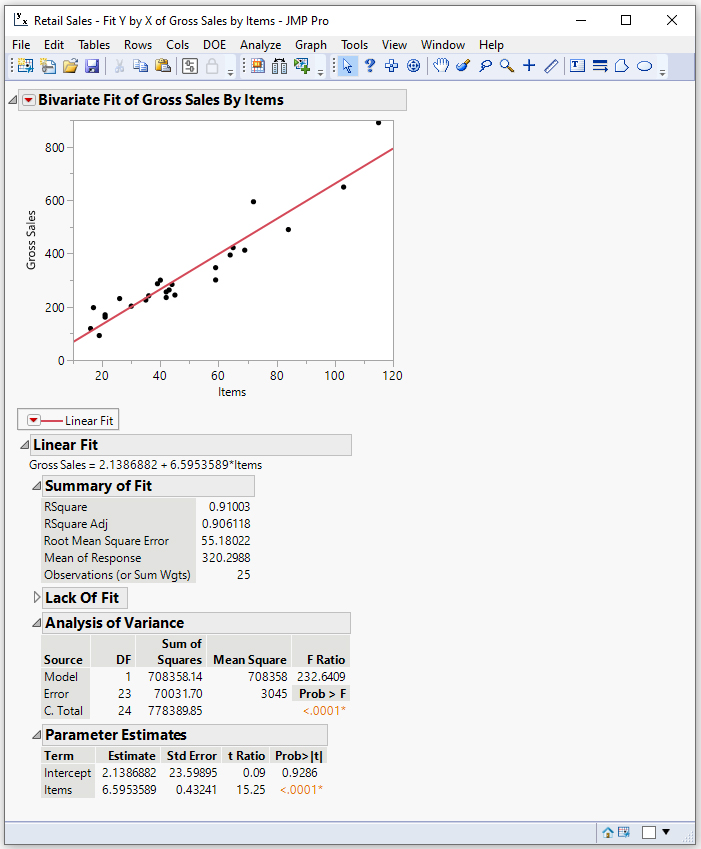
The scatter plot is produced:

Click on the red down arrow next to Bivariate Fit of Gross Sales By Items and select Fit Line:

You should see:
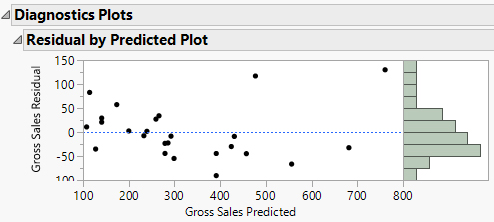
To generate the residuals plot, click the red down arrow next to Linear
Fit and select Plot Residuals.
You should see:
To make a histogram of the residuals, click the red arrow next to Linear
Fit and select Save Residuals.
Go back to the data file, and see that the last column is now Residuals Gross
Sales.
Follow the instructions for making a histogram in the tutorial
Histogram and Box Plots for the Residuals Gross
Sales column.
You should see:

(Based on JMP Pro 16.0.0 Revised 7/7/2021)