
Click the link below and save the following JMP file to your Desktop:
Now go to your Desktop and double click on the JMP file you just downloaded.
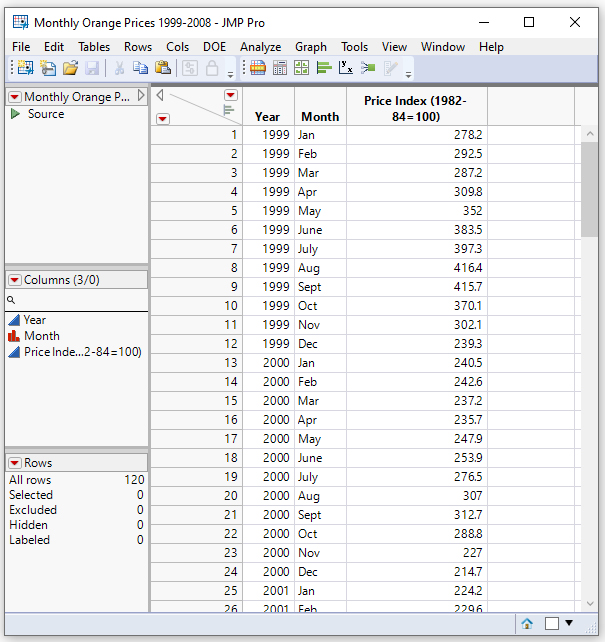
This action will start JMP and display the content of this file:
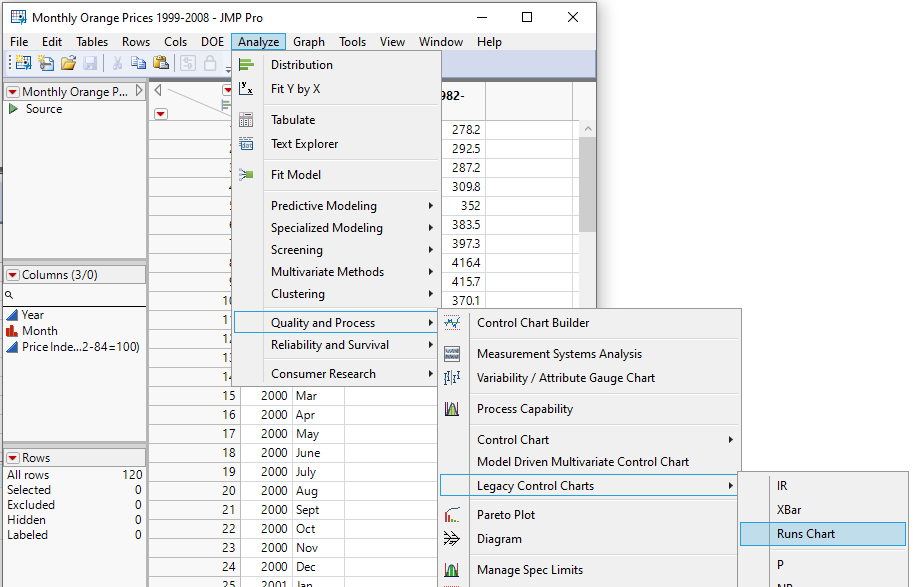
Click the Analyze menu, then select Quality and Process, then Legacy Control Charts, then Runs Chart:
Click the column Price Index(1982-84=100) then click the Process
button.
Click OK.
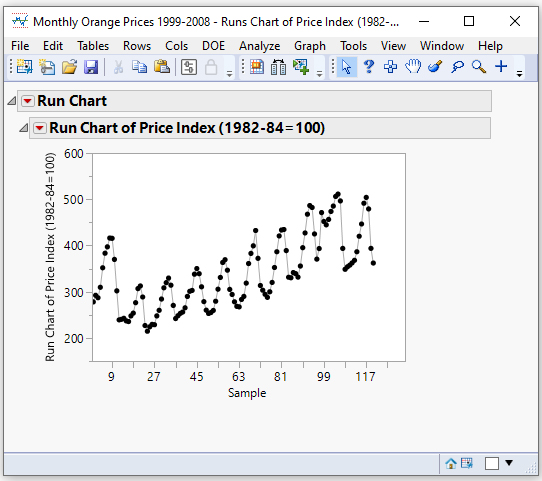
You should now see:
(Based on JMP Pro 16.0.0 Revised 7/7/2021)